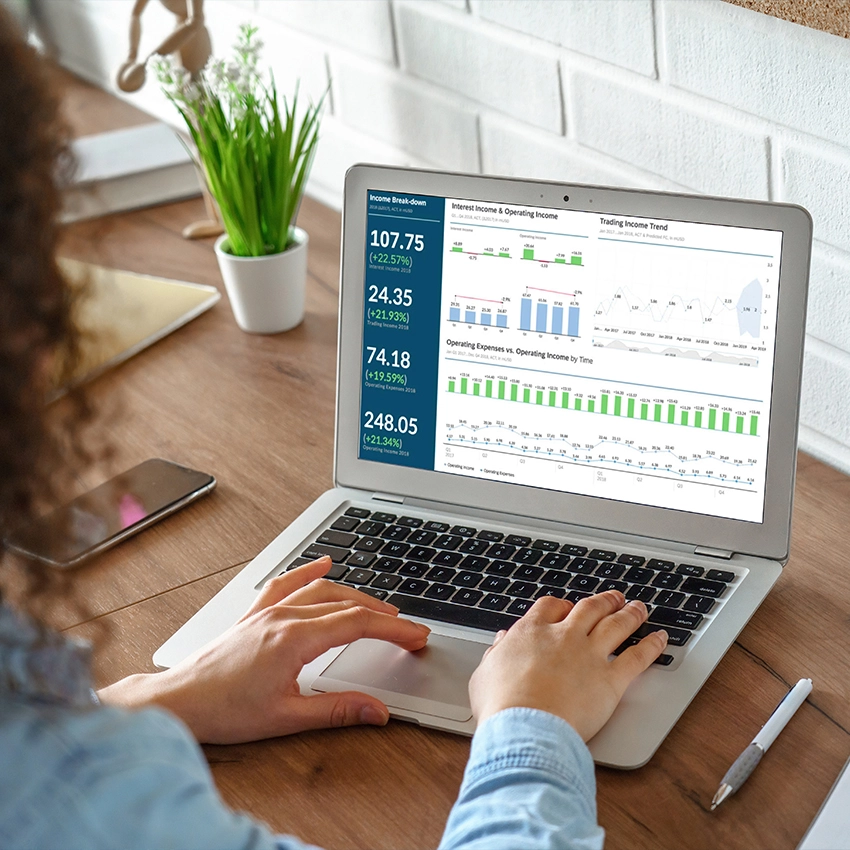
Improve operational efficiency through BI tools and streamline data collection and reporting processes. Save time and resources while increasing efficiency in business operations.
End-to-end BI platform to create a single source of truth.
Excel Reports & Interactive Analysis
Reporting Tool inside SAP Business One.
We don't skip steps
work process
Data Requirement Gathering
Data Collection
Data Cleaning
Data Analysis
Data Interpretation
Data Visualization
01. Data Requirement Gathering
Ask yourself why you’re doing this analysis, what type of data you want to use, and what data you plan to analyze.
02. Data Collection
Collect the data from all sources including case studies, surveys, interviews, questionnaires, direct observation, and focus groups.
03. Data Cleaning
Not all of the data you collect will be useful, so it should be clean ed. This process is where you remove white spaces, duplicate records, and basic errors.
04. Data Analysis
Here is where you use data analysis software and other tools to help you interpret and understand the data and arrive at conclusions like Microsoft Power BI and SAP Analytics Cloud.
05. Data Interpretation
Now that you have your results, you need to interpret them and come up with the best courses of action based on your findings.
06. Data Visualization
You can use charts, graphs, maps, bullet points, or a host of other methods. Visualization helps you derive valuable insights by helping you compare datasets and observe relationships.
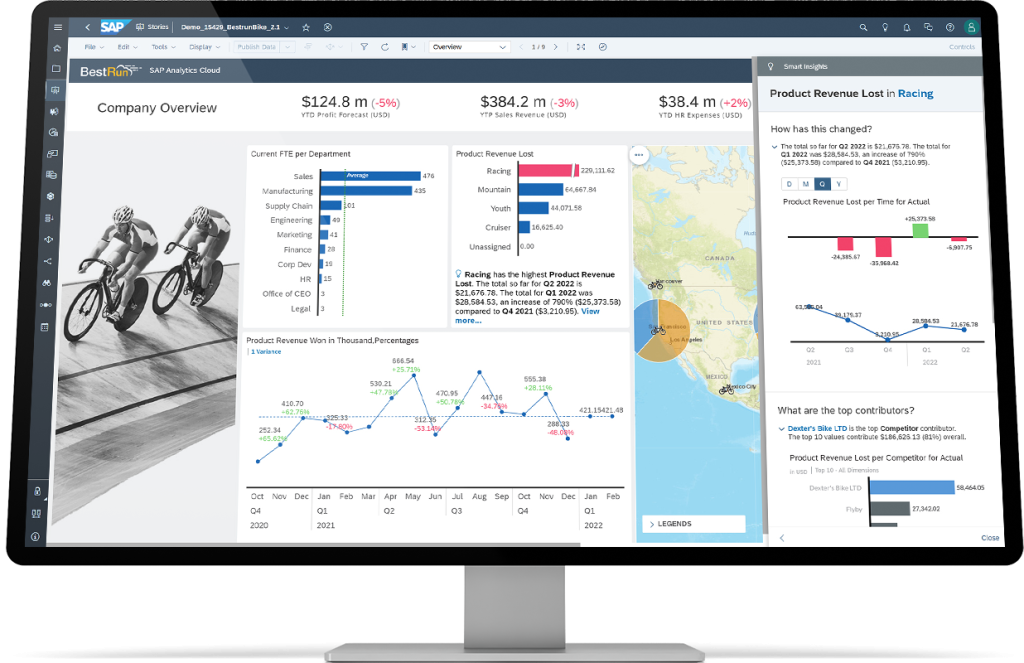
SAP Analytics Cloud is an End-to-end analytics solution that combines BI, augmented and predictive analytics, as well as planning capabilities. Through SAC you can monitor financial, operational, and sustainable business performance at a level of granularity that supports decision-making and targeted actions and a lot more.
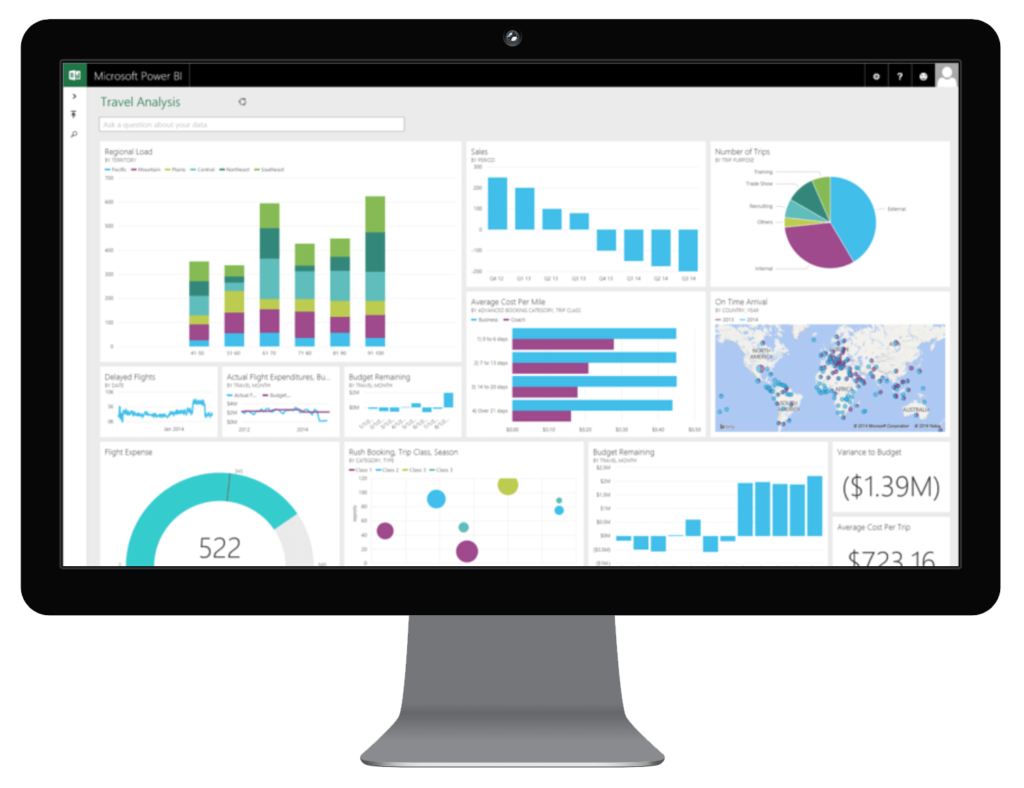
Do more with less using an end-to-end BI platform to create a single source of truth, uncover more powerful insights, and translate them into impact. Power BI is a unified, scalable platform for self-service and enterprise business intelligence (BI). Connect to and visualize any data, and seamlessly infuse the visuals into the apps you use every day.
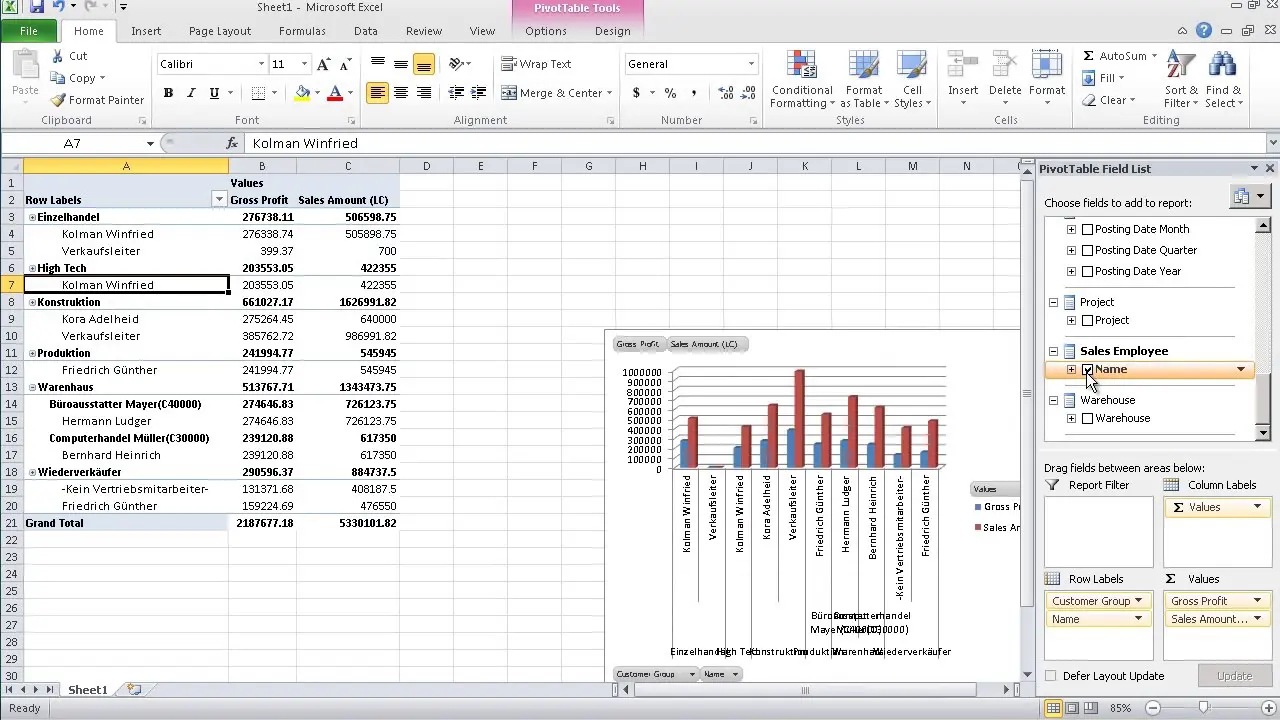
Excel Report and Interactive Analysis is a solution that provides a report designer and predefined reports. When you utilize its exclusive functions together with standard Microsoft Excel features, the designer enables you to create reports in an intuitive way. It provides real-time computing for your reports, giving you instantaneous access to your data.
SAP Analytics Cloud - SAC
SAP Analytics Cloud is an End-to-end analytics solution that combines BI, augmented and predictive analytics, as well as planning capabilities. Through SAC you can monitor financial, operational, and sustainable business performance at a level of granularity that supports decision-making and targeted actions and a lot more.
Microsoft Power BI
Do more with less using an end-to-end BI platform to create a single source of truth, uncover more powerful insights, and translate them into impact. Power BI is a unified, scalable platform for self-service and enterprise business intelligence (BI). Connect to and visualize any data, and seamlessly infuse the visuals into the apps you use every day.
Excel Reports & Interactive Analysis
Excel Report and Interactive Analysis is a solution that provides a report designer and predefined reports. When you utilize its exclusive functions together with standard Microsoft Excel features, the designer enables you to create reports in an intuitive way. It provides real-time computing for your reports, giving you instantaneous access to your data.
Do you want to know more?
If you are interested to know more about SkyTech services and how we can convert your data into valuable information that helps you take the right decision, contact us.